Proyectos
Exploring terrorism in Peru: A spatial approach
Código en R, datasets y shapefiles utilizados en mi master’s thesis “Exploring terrorism in Peru: A spatial approach” como parte del Máster en Ciencias Sociales Computacionales (MUCSS), 2022- 2023, en la Universidad Carlos III de Madrid.
| Ataques terroristas en Perú 1980-2021 | Zonas de cultivo de hoja de coca |
|---|---|
 |
 |
Abstract:
The present thesis investigates the spatial diffusion of terrorist attacks in Peru during three temporalities: the peak of violence (1980-2000), its decline (2000-2021), and the entire period (1980-2021). To study the relationships between the occurrence of terrorist attacks and geographic features, three grid-cell level datasets are constructed with which Moran’s I tests and different spatial (spatial error and spatial autoregressive) and non-spatial (linear and negative binomial) models were applied. The findings reveal that spatial autocorrelation of attacks is more pronounced during the decline period. Moreover, the effects of certain spatial variables on the number of terrorist attacks vary across time periods and models, sometimes even reversing their impact.
Palabras que se las lleva el viento
Técnicas de minería de textos aplicadas a los 10 últimos discursos de investidura de presidentes peruanos: N-grams, análisis de sentimiento y Latent Dirichlet Allocation (LDA).


Recolectando las estadísticas de los jugadores de la EURO 2024.
Con Python y Selenium.

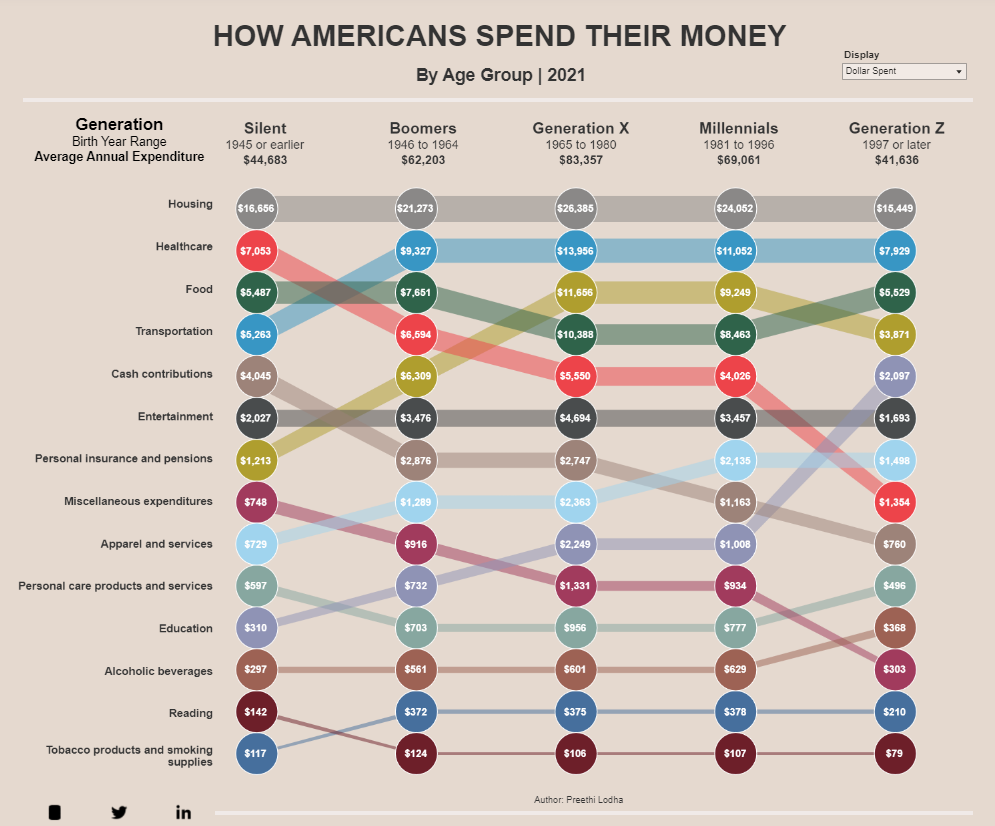
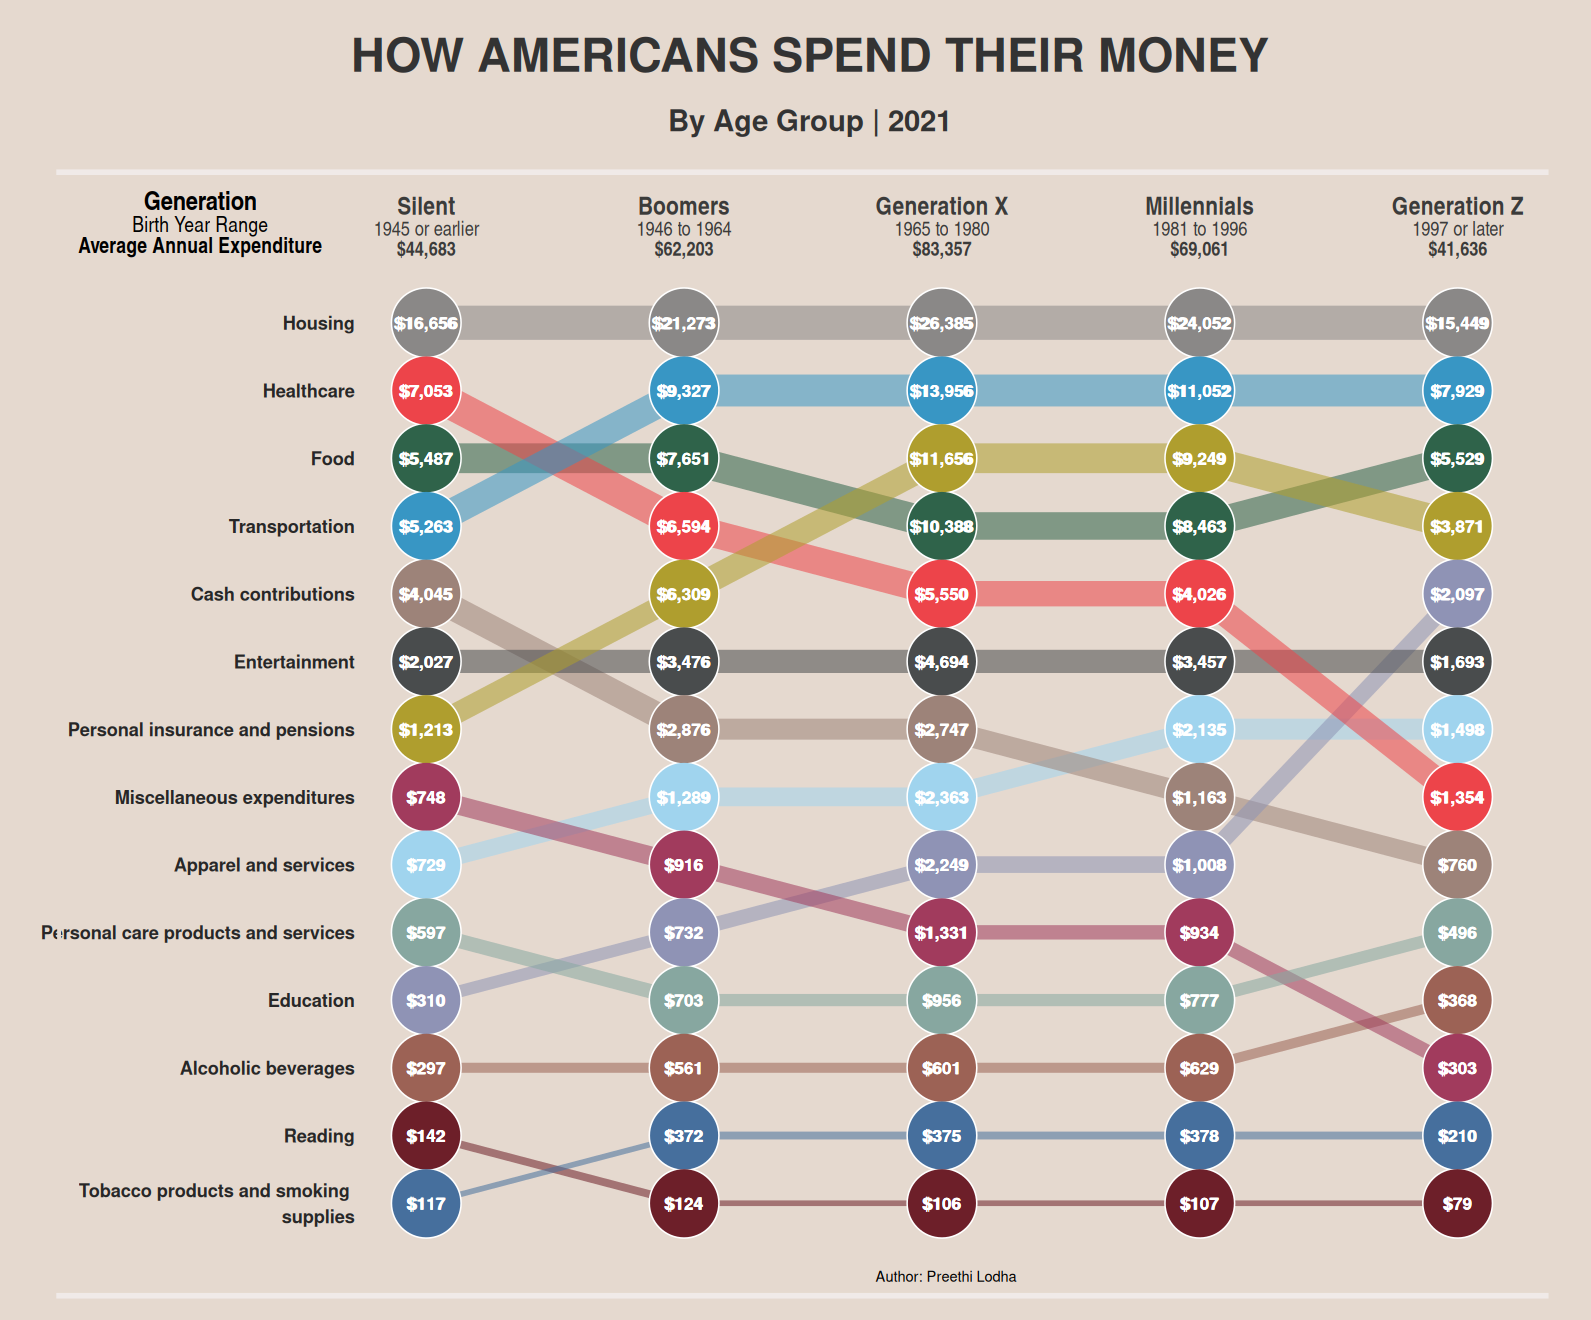
How Americans spend their money
Réplica en R de un bump chart interactivo originalmente elaborado en Tableau, y discusión a la luz de las teorías sobre visualización de datos de Tufte, Cleveland y Wikilson.
| Gráfico original en Tableau | Mi réplica en R |
|---|---|
 |
 |
Scraping y análisis de sentimientos de los tweets del congresista peruano Alejandro Cavero
Scrapeé los tweets del congresista peruano Alejandro Cavero (cuando la API era aún gratuita). Análisis de sentimientos, visualizaciones, clustering, etc.

Visualizando los colegios en zonas inundables con QGIS
- Matriz de distancia y búffers.
Scrapeando los precios de productos básicos en un supermercado
Con R.